Launch & ramp-up confidence
Know whether tooling, suppliers, approvals and demonstrated capacity support the next milestone. TTWCI identifies the open risks and builds a gated recovery plan with program and plant leaders.
Explore launch support →
AUTOMOTIVE · OEMs · EVs · SUPPLY CHAIN
Protect launch commitments, stabilize suppliers and improve plant performance. TTWCI connects operating priorities with hands-on implementation and leadership coaching.
A CLEAR CONSULTING STARTING POINT
Protect launch milestones, stabilize critical suppliers and reduce quality and delivery losses with a practical recovery plan.
WHERE TTWCI CAN HELP
Select a priority for the work involved, the deliverables and the measures of progress.
Know whether tooling, suppliers, approvals and demonstrated capacity support the next milestone. TTWCI identifies the open risks and builds a gated recovery plan with program and plant leaders.
Explore launch support →Protect customer commitments when shortages or supplier underperformance disrupt production. Review critical dependencies, capacity, material flow and escalation, then coach the recovery at its source.
Explore supplier recovery →Find the losses behind scrap, rework, downtime, excess stock and premium freight. Prioritize process and footprint improvements using cost per good unit and verified delivery performance.
Explore operational improvement →Connect field complaints and ownership experience to engineering, suppliers and production. Verify root causes, close corrective actions and track recurrence alongside customer and warranty measures.
Explore quality improvement →FIVE CONNECTED CAPABILITIES
THE THREE MEASURES THAT CONNECT EVERYTHING
Reliable products, stable processes and an ownership experience customers trust.
First-pass yield · Returns · Repeat complaintsMore value from materials, equipment and paid work hours, with less waste and rework.
Cost per good unit · Labor hours per good unit · ScrapDependable launches, realistic capacity and orders delivered as promised.
On-time in-full · Lead time · Schedule attainmentUse consistent definitions across sites, compare similar products and processes, and protect safety and product standards while improving productivity.
ASSESSMENTS & IMPLEMENTATION PROGRAMS
Explore a focused engagement below. Each can stand alone or become part of a wider manufacturing improvement program.
Protect production when demand, supplier capacity and material availability change.
Map critical parts and tier dependencies; assess supplier capability, capacity, delivery and recovery risks. Review sales and operations planning, inventory policies, procurement handoffs and escalation. Coach suppliers on process stability and corrective action.
A supplier risk heat map, capacity and material-flow assessment, recovery plans, replenishment rules and a shared supplier scorecard.
On-time in-full delivery, supplier defects per million, inventory days, shortages, premium freight and recovery milestones.
A critical supplier misses schedules despite high inventory. Segment the stock, verify the constraint, reset replenishment signals and run a supplier recovery plan with weekly evidence reviews.
Choose production locations using total operating economics and transfer readiness.
Compare onshore, nearshore and offshore scenarios, including labor productivity, logistics, tooling, quality losses, working capital, supplier depth and applicable trade assumptions. Stress-test volume and exchange-rate scenarios; plan qualification and production transfer gates.
A location comparison, total-landed-cost model, sensitivity analysis and phased transfer plan covering tooling, suppliers, people, capacity and customer approvals.
Total landed cost per good unit, required capital, lead time, transfer readiness and post-transfer quality and delivery.
A component business considers regional production. Compare staying, adding a second source and transferring a product family before committing capital; validate tariff assumptions with the client’s trade specialists.
Find readiness gaps before they become missed milestones, quality escapes or unstable output.
Review Advanced Product Quality Planning (APQP), Production Part Approval Process (PPAP), tooling, measurement systems, process risks and control plans against applicable customer requirements. Verify run-at-rate capacity, workforce readiness and safe-launch controls; manage ramp-up escalation.
A launch readiness assessment, risk register, gated recovery schedule, supplier action tracker and daily launch management system.
Open high-risk issues, approval status, capacity demonstrated, first-pass yield, launch defects and schedule attainment.
An OEM or EV program has late supplier approvals and unstable line output. Establish a launch control room, verify bottlenecks on site and close readiness gaps against evidence-based gates.
Connect development, supplier and production quality with warranty, dealer service and the ownership experience.
Combine field complaints, warranty repairs, plant defects and customer feedback. Separate design usability concerns from manufacturing defects; prioritize recurrence and customer impact. Use 8D problem solving, root-cause verification, error proofing and updated controls. Include digital-feature usability and service handoffs where they drive dissatisfaction.
A quality loss assessment, customer-issue Pareto, corrective-action portfolio, revised control standards and a closed-loop feedback process from the field to engineering and suppliers.
Cost of poor quality, warranty recurrence, first-time repair, complaint resolution time, first-pass yield and customer satisfaction.
Repeat complaints have different dealer descriptions. Standardize issue coding, reproduce the customer condition and verify a corrective action across engineering, the supplier, production and service.
Turn benchmark findings into product and service improvements that customers can experience.
Review authorized J.D. Power data and other relevant consumer studies alongside internal warranty, surveys and reviews. Separate initial quality, longer-term dependability, product appeal and service satisfaction; use each study’s current definitions and comparable market segments. Identify the largest actionable gaps and assign engineering, manufacturing, supplier or service owners.
A benchmark gap assessment, customer-expectation map, prioritized improvement roadmap and monthly progress scorecard. Track corrective-action effectiveness first, then review subsequent comparable study results.
Customer-reported problems, recurring issue themes, service outcomes and study-specific measures where licensed data is available. Keep score trends separate from rank changes.
If connectivity complaints drive a benchmark gap, validate the customer journey, distinguish software and usability causes from hardware defects, and coordinate verified fixes and dealer guidance.
Improve quality, cost and delivery through the Toyota Production System and consistent daily management.
Observe the work at the source; map value streams, standard work, takt and cycle times, changeovers, material flow and problem escalation. Build pull systems, quality at the source, leader routines and supervisor coaching. Benchmark similar lines and sites with consistent measures.
A TPS maturity assessment, constraint map, standard-work and training package, improvement-event plan and multi-site quality-cost-delivery scorecard.
Labor hours per good unit, first-pass yield, work in process, changeover time, throughput and delivery attainment.
One site performs well while another needs overtime to ship. Compare product mix and work content, stabilize the bottleneck and replicate validated work methods with local team coaching.
Invest in technology where it can remove a proven constraint and sustain measurable benefits.
Assess process stability, equipment, data quality, skills and integration readiness. Evaluate machine vision, predictive maintenance, scheduling support, robotics and AI-assisted troubleshooting. Compare process-only improvements with automation options, full lifecycle cost and pilot acceptance criteria.
A ranked opportunity portfolio, readiness gaps, pilot business cases, integration requirements and a repeatable rollout and training plan.
Verified savings, uptime, defect escapes, throughput, staff adoption and actual payback against the agreed business case.
Pilot machine vision at a recurring inspection bottleneck, validate detection and false-reject performance, and scale only after production teams can maintain the process.
Align the operating network, product commitments and capital priorities with the business plan.
Review portfolio complexity, demand scenarios, make-or-buy choices, leadership capacity and investment priorities. Translate strategy into site-level targets, accountable programs and recurring operating reviews.
A manufacturing strategy, prioritized capital and improvement roadmap, decision gates and leadership scorecard.
Quality-cost-delivery trends, cash released, capital milestones, benefits achieved and overdue actions.
A supplier must choose between expanding capacity and improving existing assets. Validate demand and constraint data, compare the alternatives and establish staged investment decisions.
Examples illustrate the approach; they are not reported client results. Targets and benefits are established from the operating baseline.
TTWCI’s Toyota foundation covers development and production quality, supplier capability, quality engineering and structured improvement. It includes Toyota OMDD training and prior leadership in the North American Supplier Development Program, bringing practical methods for building stronger operations and suppliers.
That leadership experience also includes global product and process advisory at J.D. Power and internal and external quality at Lordstown Motors, including electric-truck development quality.
Read Tim’s executive biography →Experience across industries →A scoped 10-day assessment establishes the baseline and produces an action plan with owners, milestones and benefit assumptions. Multi-facility work is scoped to the number and complexity of sites.
Intensive on-site guidance, problem-solving workshops, supervisor training and focused technology pilots take the ideas from concept to reality.
Quarterly visits, quality-cost-delivery scorecards and continued coaching verify progress and spread effective practices across the network.
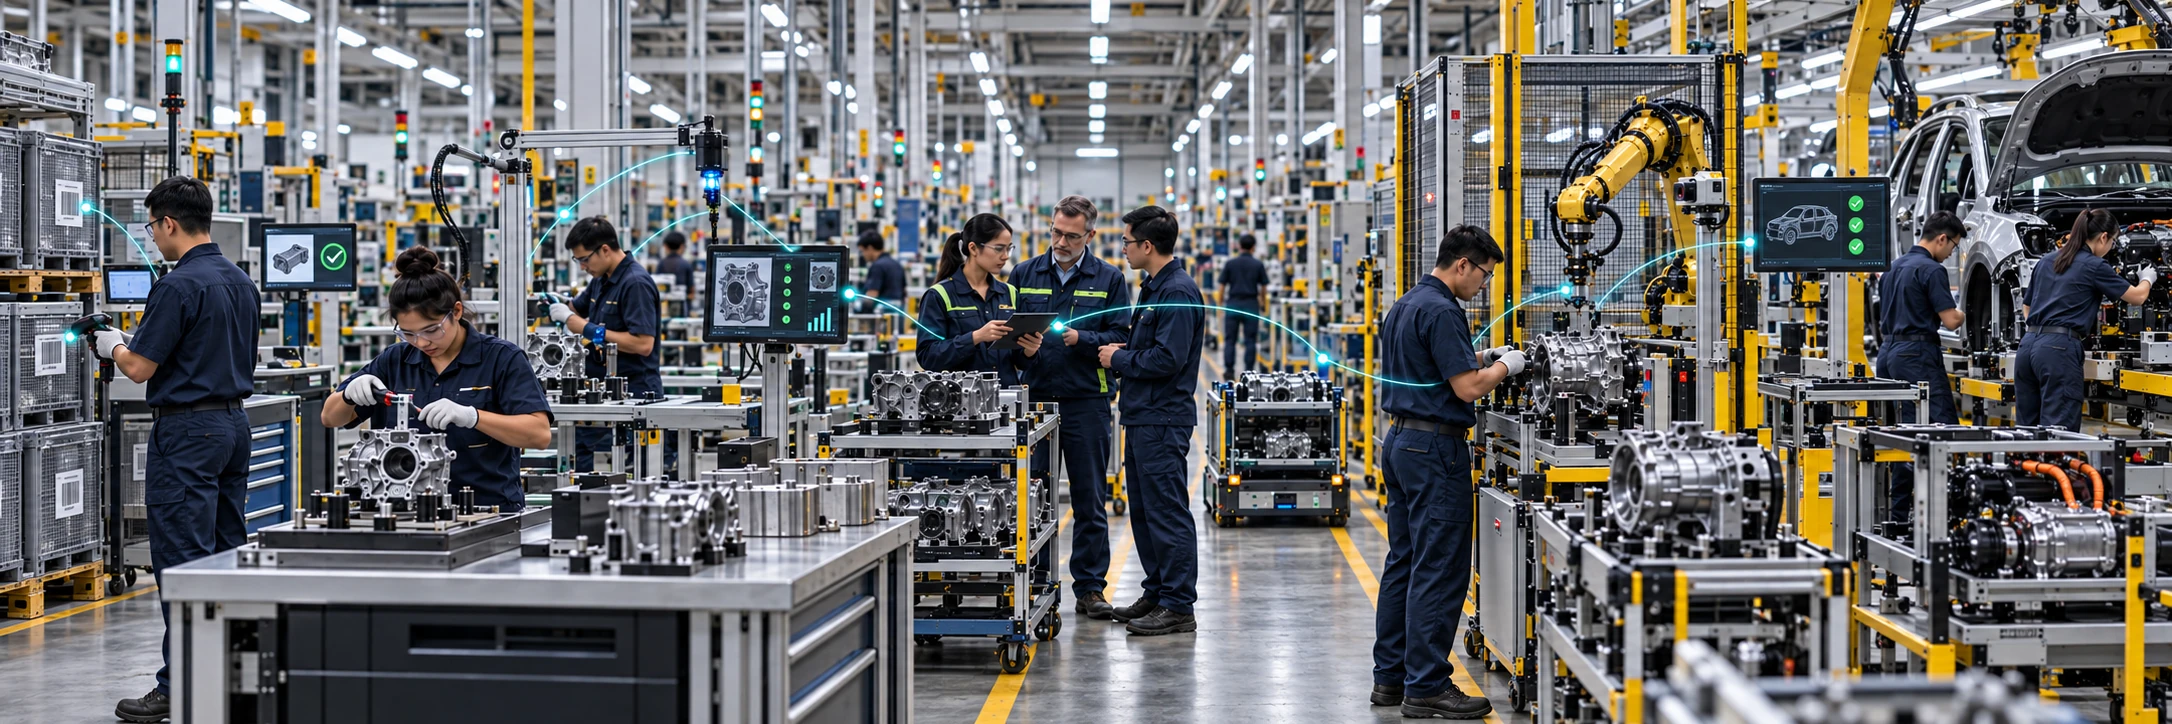
Connected manufacturing can link inspection results, assembly status and material flow. BMW’s Car2X and AIQX show production communication and sensor-based quality checks; BMW’s AI overview also describes smart transport and humanoid research. TTWCI evaluates robotics against the actual process and business case.
AlixPartners and Roland Berger emphasize competitiveness, regional production and changing supply networks. J.D. Power’s 2026 initial-quality findings highlight connectivity and usability alongside physical quality. AIAG provides the core-tool framework for production quality and launch planning.
These independent sources inform the operating priorities above. They are background references; the engagement is scoped to your business and available evidence.
Additional executive context: BCG’s 2026 automotive supplier study.