
FOOTWEAR · APPAREL · SPORTING GOODS

Footwear & sporting goods consulting

Protect product margin, seasonal delivery and customer trust. TTWCI connects brand requirements, supplier capability and factory performance with practical implementation.

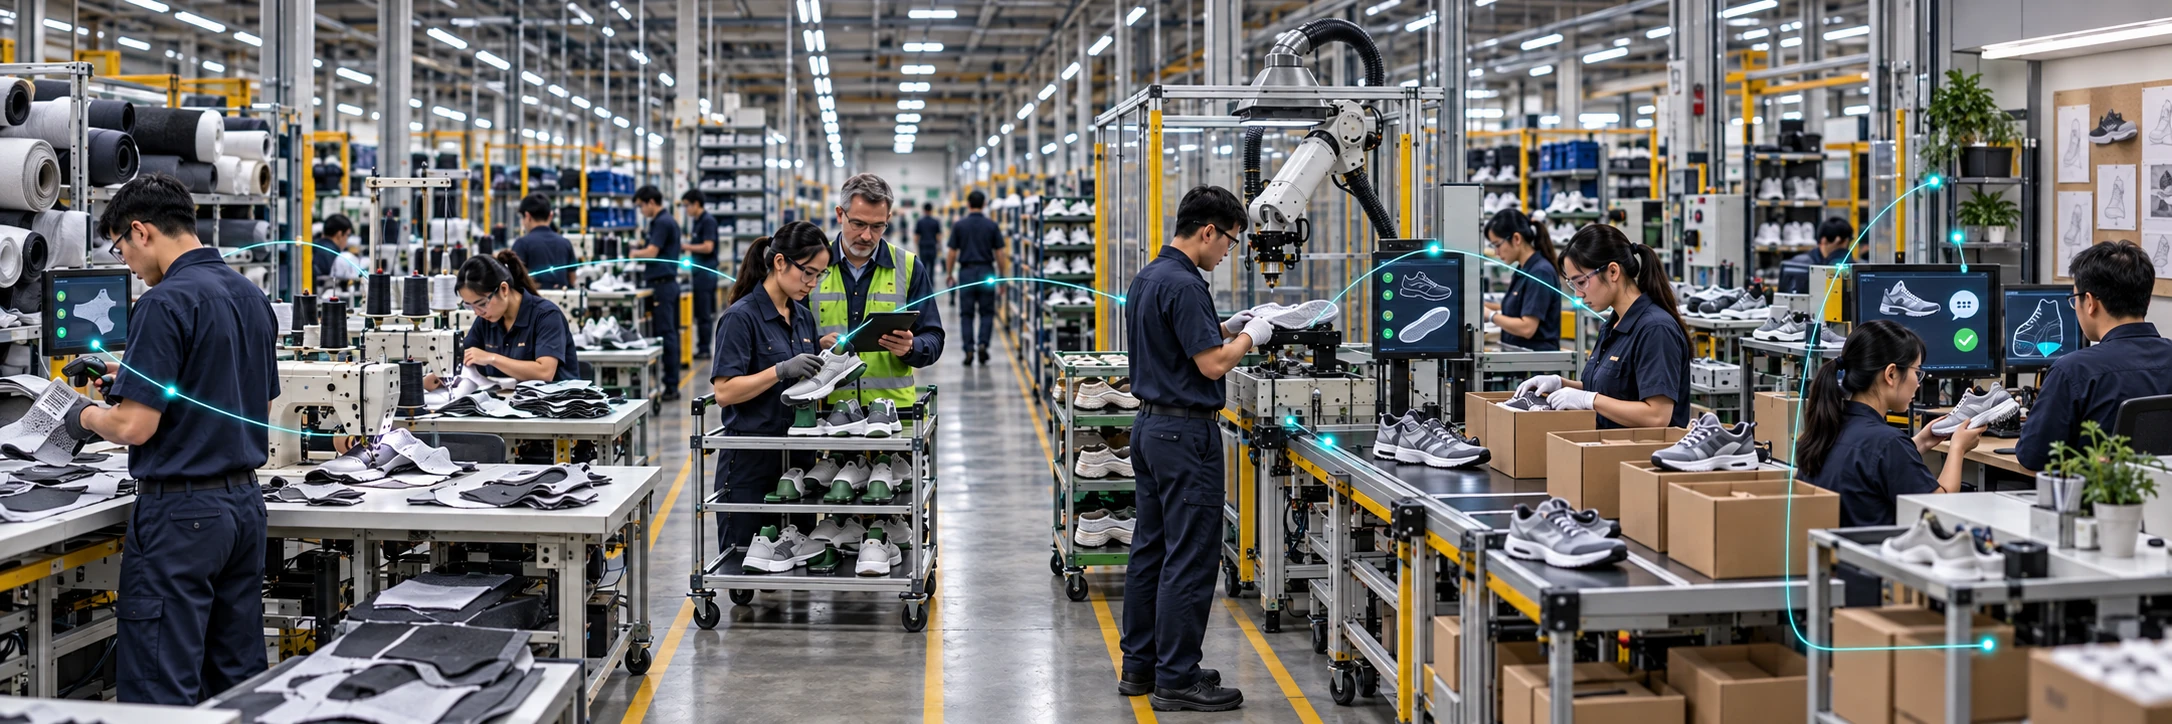
Conceptual footwear factory connecting material scans, traditional stitching and assembly, AI quality checks, packing and customer feedback returning to design and production

A CLEAR CONSULTING STARTING POINT

Footwear Factory & Supplier Performance Assessment

Improve product margin, seasonal delivery and factory productivity by connecting customer expectations, suppliers and production.

WHERE TTWCI CAN HELP

Start with the decision your business needs to make.

Select a priority for the work involved, the deliverables and the measures of progress.

Margin, materials & factory productivity

Understand material yield, rework, line balance and labor hours per good unit. Improve the actual production constraint, then evaluate automation where the process and investment case support it.

Explore factory productivity →

Seasonal delivery & inventory

Align samples, approvals, materials and factory capacity with launch dates and replenishment. Reduce late orders and aged stock by improving the handoffs between planning, suppliers and production.

Explore supplier and delivery performance →

Product quality & avoidable returns

Translate fit, comfort, durability and customer feedback into product requirements and factory controls. Connect recurring return reasons with materials, process conditions and verified improvements.

Explore product quality →

Sourcing resilience & growth

Qualify suppliers and compare production locations against landed cost, skills, quality and lead time. Plan transfers and new-product scale-up with clear approval and capacity gates.

Explore sourcing and expansion →

FIVE CONNECTED CAPABILITIES

THE THREE MEASURES THAT CONNECT EVERYTHING

Quality. Cost. Delivery.

Quality

Product consistency, fit, finish and durability that meet consumer expectations.

First-pass yield · Returns · Repeat complaints

Cost

More value from materials, equipment and paid work hours, with less waste and rework.

Cost per good unit · Labor hours per good unit · Scrap

Delivery

Dependable launches, realistic capacity and orders delivered as promised.

On-time in-full · Lead time · Schedule attainment

Use consistent definitions across sites, compare similar products and processes, and protect safety and product standards while improving productivity.

ASSESSMENTS & IMPLEMENTATION PROGRAMS

Consulting programs and deliverables

Explore a focused engagement below. Each can stand alone or become part of a wider manufacturing improvement program.

QUALITY · FROM BRAND PROMISE TO PRODUCTIONConsumer expectations & product quality standards

Make the acceptance standard reflect what customers notice, value and expect over the product’s life.

How we work

Map reviews, returns and wear-test findings to measurable product requirements. Review fit, comfort, sizing, durability, materials, finish and function for the category. Align design intent, approved samples, inspection methods and supplier controls; preserve craftsmanship where judgment matters.

What you receive

A consumer-expectation-to-quality matrix, reference-sample system, acceptance criteria, defect priorities and corrective-action plan.

What we track

Return reasons, product complaints, first-pass yield, rework, repeat defects and relevant fit or durability test results.

Example application

A shoe passes visual inspection but attracts comfort complaints. Translate wear-test feedback into fit and material requirements, validate the production process and update supplier acceptance criteria.

PILLAR 04 · AUTOMATION, AI & WORK-HOUR EFFICIENCYLean & advanced manufacturing assessment

Get more good product from available work hours while maintaining safety, quality and sustainable workloads.

How we work

Observe cutting, stitching, molding, assembly, finishing and packing as relevant. Review time studies, line balance, ergonomics, skill coverage, downtime and rework. Assess AI quality inspection, production planning, digital work instructions and targeted automation against stable lean processes and data readiness.

What you receive

A labor and process-loss analysis, lean maturity assessment, automation and AI opportunity map, investment cases and a pilot-to-rollout plan with operator training.

What we track

Good units per paid labor hour, labor hours per good unit, line balance, first-pass yield, downtime and verified technology benefits. Normalize comparisons for product complexity and learning curves.

Example application

A footwear line relies on overtime while work queues build before finishing. Rebalance work and address defects first, then evaluate targeted handling automation or AI inspection at the verified constraint.

PILLAR 02 · SUPPLIER DEVELOPMENT & SUPPLY CHAINSupplier capability, inventory & delivery reliability

Meet seasonal commitments and replenishment needs with a supply network that can respond.

How we work

Assess suppliers, materials readiness, capacity reservations, minimum order quantities and demand-to-production handoffs. Review stock exposure, material traceability, subcontractor visibility and sales and operations planning. Establish supplier development plans and exception escalation.

What you receive

A supplier capability scorecard, material-risk map, inventory and capacity review, delivery recovery plan and recurring supplier review routine.

What we track

On-time in-full delivery, lead time, stockouts, aged stock, schedule attainment and supplier quality.

Example application

A collection is late despite finished stock elsewhere in the network. Find material and approval bottlenecks, align capacity to the product mix and establish a short-interval recovery plan.

PILLAR 01 · GLOBAL EXPANSION & ONSHORINGSourcing footprint, onshoring & offshoring

Balance landed cost, speed, quality and supply resilience when choosing where to make products.

How we work

Compare existing and alternative production locations, including Vietnam, Thailand, Indonesia and other appropriate markets. Review supplier skills, material ecosystems, logistics, trade assumptions, traceability and transfer readiness. Assess dual sourcing and near-market replenishment.

What you receive

A sourcing scenario model, factory qualification plan and staged production-transfer roadmap with quality and capacity gates.

What we track

Total landed cost, replenishment lead time, supplier concentration, qualification progress and transfer quality.

Example application

A sporting-goods brand needs a second manufacturing base. Qualify process capability and materials before transferring volume, then compare actual cost and delivery with the business case.

PILLAR 03 · OPERATIONAL EXCELLENCETPS, operational efficiency & multi-site improvement

Create repeatable quality, cost and delivery performance across factories and product families.

How we work

Apply TPS principles to standard work, flow, pull replenishment, changeovers, visual management and quality at the source. Review cutting yield, material scrap, energy use and excess handling. Compare like-for-like lines, coach supervisors and build a shared training system.

What you receive

A value-stream assessment, prioritized waste-reduction plan, standard-work library, supervisor coaching modules and a common factory scorecard.

What we track

Material yield, scrap, labor hours per good unit, changeover time, work in process, energy per unit and on-time delivery.

Example application

Factories report productivity differently. Establish common definitions, isolate product-mix effects and transfer the practices that improve good output without increasing quality losses.

PILLAR 05 · EXECUTIVE STRATEGYManufacturing strategy, product launches & scale-up

Connect growth plans and new collections with the operating capability to deliver them.

How we work

Review product complexity, cost targets, make-or-buy decisions, tooling and capital priorities. Set sample-to-production gates, pilot-build standards, capacity checks and leadership responsibilities. Plan launches around seasonal commitments and available skills.

What you receive

An industrialization and launch-readiness plan, capital roadmap, executive quality-cost-delivery scorecard and accountable implementation schedule.

What we track

Approval lead time, launch readiness, unit cost, capacity demonstrated, seasonal delivery and realized investment benefits.

Example application

A new product family requires unfamiliar processes. Validate pilot builds and supplier readiness, coach the launch team and expand only after quality and delivery gates are met.

Examples illustrate the approach; they are not reported client results. Targets and benefits are established from the operating baseline.

Brand value, premium positioning & customer loyalty

Align the product promise with materials, comfort, durability, finishing and aftercare. Benchmark the customer experience against the intended price position; review recurring return reasons and supplier quality gaps. Build an improvement plan connecting product development, operations and the commercial team.

Track repeat purchase, return reasons, full-price sell-through and resolution of recurring quality issues.

Digital product discovery & commerce readiness

Review product descriptions, specifications, sizing guidance and customer-service knowledge. Improve the consistency of information across channels and assess AI-assisted workflows against practical service and merchandising needs.

Track product-information completeness, customer query resolution and avoidable returns caused by unclear expectations.

From assessment to daily practice.

Assess & prioritize

A scoped 10-day assessment establishes the baseline and produces an action plan with owners, milestones and benefit assumptions. Multi-facility work is scoped to the number and complexity of sites.

Implement & coach

Intensive on-site guidance, problem-solving workshops, supervisor training and focused technology pilots take the ideas from concept to reality.

Sustain & replicate

Quarterly visits, quality-cost-delivery scorecards and continued coaching verify progress and spread effective practices across the network.

Explore the 10-day assessment →See all improvement approaches →Discuss your priorities →
Industry and technology references
Industry priorities & research references

Footwear automation works alongside skilled manual processes. DESMA’s amir®c systems demonstrate scanning, robotic roughing and cement application, with barcode or RFID production recipes connecting the process. The illustration connects traditional footwear production with data collection, quality review and customer feedback.

McKinsey’s State of Fashion 2026 highlights sourcing changes, efficiency and targeted technology investment. Bain and BCG describe manufacturing approaches that combine process improvement, supply-chain capabilities and AI. TTWCI applies these themes to footwear, apparel and sporting-goods operations.

These independent sources inform the operating priorities above. They are background references; the engagement is scoped to your business and available evidence.

Additional executive context: WFSGI / McKinsey sporting goods research.